Your Modern Business Guide To Data Analysis Methods And Techniques
In our data-rich age, understanding how to analyze and extract true meaning from the digital insights available to our business is one of the primary drivers of success.
Despite the colossal volume of data we create every day, a mere 0.5% is actually analyzed and used for data discovery, improvement, and intelligence. While that may not seem like much, considering the amount of digital information we have at our fingertips, half a percent still accounts for a huge amount of data.
With so much big data and so little time, knowing how to collect, curate, organize, and make sense of all of this potentially business-boosting information can be a minefield – but online data analysis is the solution.
To help you understand the potential of analysis, the meaning, and how you can use it to enhance your business practices, we will answer a host of important analytical questions. Not only will we explore data analysis methods and techniques, but we’ll also look at different types of data analysis while demonstrating how to perform analysis in the real world with a 15-step blueprint for success.
What Is Data Analysis?
Data analysis is a process that relies on methods and techniques to taking raw data, mining for insights that are relevant to the business’s primary goals, and drilling down into this information to transform metrics, facts, and figures into initiatives for improvement.
There are various methods for data analysis, largely based on two core areas: quantitative data analysis methods and data analysis methods in qualitative research.
To explain the key differences between qualitative and quantitative data, here’s a video for your viewing pleasure:
Gaining a better understanding of different techniques for data analysis, and methods in quantitative research as well as qualitative insights, will give your information analyzing efforts a more clearly defined direction, so it’s worth taking the time to allow this particular knowledge to sink in. Additionally, you will be able to create a comprehensive analytical report that will skyrocket your analysis processes.
How To Analyze Data: Take Advantage Of The Top 15 Data Analysis Methods & Techniques
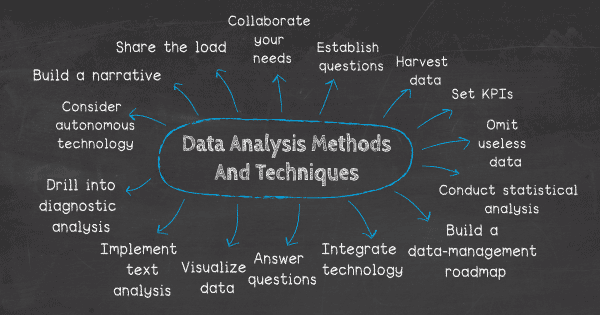
Now that we’ve answered the question, ‘what is data analysis?’, considered the different types of analysis methods, it’s time to dig deeper into how to do data analysis by working through these 15 essential elements.
1. Collaborate your needs
Before you begin to analyze your data or drill down into any analysis techniques, it’s crucial to sit down collaboratively with all key stakeholders within your organization, decide on your primary campaign or strategic goals, and gain a fundamental understanding of the types of insights that will best benefit your progress or provide you with the level of vision you need to evolve your organization.
2. Establish your questions
Once you’ve outlined your core objectives, you should consider which questions will need answering to help you achieve your mission. This is one of the most important data analytics techniques as it will shape the very foundations of your success.
To help you ask the right things and ensure your data works for you, you have to ask the right data analysis questions.
3. Harvest your data
After giving your data analytics methodology real direction and knowing which questions need answering to extract optimum value from the information available to your organization, you should decide on your most valuable data sources and start collecting your insights – the most fundamental of all data analysis techniques.
4. Set your KPIs
Once you’ve set your data sources, started to gather the raw data you consider to offer potential value, and established clear-cut questions you want your insights to answer, you need to set a host of key performance indicators (KPIs) that will help you track, measure, and shape your progress in a number of key areas.
KPIs are critical to both analysis methods in qualitative and quantitative research. This is one of the primary methods of analyzing data you certainly shouldn’t overlook.
To help you set the best possible KPIs for your initiatives and activities, explore our collection of key performance indicator examples.
5. Omit useless data
Having bestowed your data analysis techniques and methods with true purpose and defined your mission, you should explore the raw data you’ve collected from all sources and use your KPIs as a reference for chopping out any information you deem to be useless.
Trimming the informational fat is one of the most crucial methods of data analysis as it will allow you to focus your analytical efforts and squeeze every drop of value from the remaining ‘lean’ information.
Any stats, facts, figures, or metrics that don’t align with your business goals or fit with your KPI management strategies should be eliminated from the equation.
6. Conduct statistical analysis
One of the most pivotal types of analysis is statistics.
This kind of analysis method focuses on aspects including cluster, cohort, regression, factor, and neural networks and will ultimately give your data analysis methodology a more logical direction.
Here is a quick glossary of these vital statistical analysis terms for your reference:
- Cluster: The action of grouping a set of elements in a way that said elements are more similar (in a particular sense) to each other than to those in other groups – hence the term ‘cluster’. This approach is used to provide additional context to a trend or dataset.
- Cohort: A subset of behavioral analytics that takes insights from a given data set (e.g. a web application or CMS) and instead of looking at everything as one wider unit, each element is broken down into related groups. By using this analysis methodology, it’s possible to gain a wealth of insight into consumer needs or a firm understanding of a wider target group.
- Regression: A definitive set of statistical processes centered on estimating the relationships among particular variables to gain a deeper understanding of particular trends or patterns. This is an analysis methodology that is incredibly powerful when focused on predictive analytics.
- Factor: A statistical practice utilized to describe variability among observed, correlated variables in terms of a potentially lower number of unobserved variables called ‘factors’. The aim here is to uncover independent latent variables. An ideal method of analysis for streamlining specific segments of data.
- Neural networks: A neural network is a form of machine learning (ML) focused on predicting the outcome of a specific variable. This concept is far too comprehensive to summarize – but this explanation will help paint you a fairly comprehensive picture. Later in the article, we will also focus more on this term.
- Data modeling: A method of analysis that is the umbrella term for engineering metrics and insights for additional value, direction, and context by using a mix of strategies and techniques. When considering how to analyze data, adopting a data modeling mindset is essential to success - as such, it’s an area that is worth exploring in greater detail.
- Predictive analytics: Again, while this is a broad term (and something we will revisit in due course), when you’re looking at how to do analysis the right way, you should ensure this term is firmly ingrained in your mind. Predictive analytical techniques are essential as they will empower you to spot invaluable trends as they unfold and develop initiatives that will not only enhance your various operational processes but also help you gain an all-important edge on the competition.
7. Build a data management roadmap
While, at this point, this particular step is optional (you will have already gained a wealth of insight and formed a fairly sound strategy by now), creating a data governance roadmap will help your data analysis methods and techniques become successful on a more sustainable basis. These roadmaps, if developed properly, are also built so they can be tweaked and scaled over time.
Invest ample time in developing a roadmap that will help you store, manage, and handle your data internally, and you will make your analysis techniques all the more fluid and functional – one of the most powerful types of data analysis methods available today.
8. Integrate technology
There are many ways to analyze data, but one of the most vital aspects of analytical success in a business context is integrating the right decision support software and technology.
Robust analysis platforms will not only allow you to pull critical data from your most valuable sources while working with dynamic KPIs that will offer you actionable insights; it will also present the information in a digestible, visual, interactive format from one central, live dashboard. A data analytics methodology you can count on.
By integrating the right technology for your statistical method data analysis and core data analytics methodology, you’ll avoid fragmenting your insights, saving you time and effort while allowing you to enjoy the maximum value from your business’s most valuable insights.
For a look at the power of software for the purpose of analysis and to enhance your methods of analyzing data, glance over our selection of dashboard examples.
9. Answer your questions
By considering each of the above efforts, working with the right technology, and fostering a cohesive internal culture where everyone buys into the different ways to analyze data as well as the power of digital intelligence, you will swiftly start to answer your most burning business questions. Arguably, the best way to make your data concepts accessible across the organization is through data visualization.
10. Visualize your data
Online data visualization is a powerful tool as it lets you tell a story with your metrics, allowing users across the business to extract meaningful insights that aid business evolution – and it covers all the different ways to analyze data.
The purpose of data analysis is to make your entire organization more informed and intelligent, and with the right platform or dashboard, this is simpler than you think, as demonstrated by our marketing dashboard.
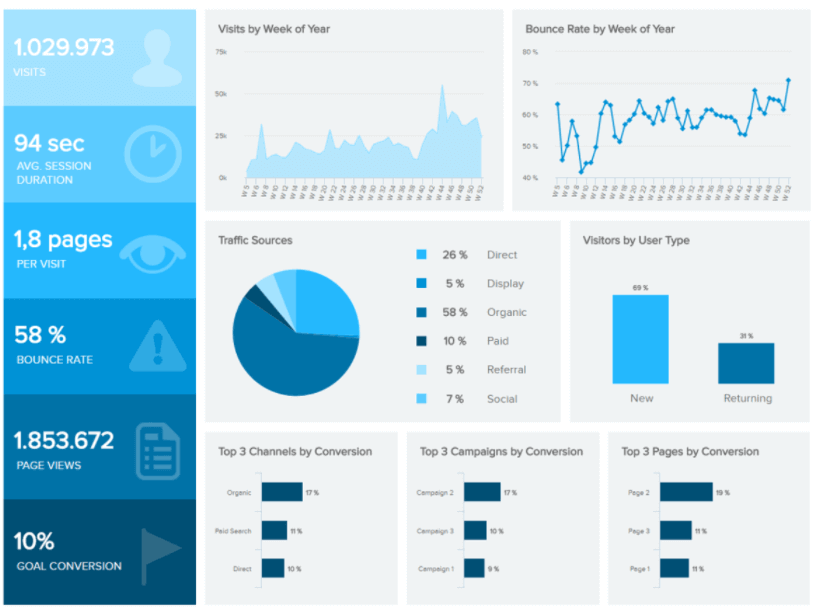
**click to enlarge**
Primary KPIs:
- Bounce Rate
- Average Sessions Duration
- Goal Conversion Rates
- Landing Page Conversion Rates
Delving deeper than the user data served up by Google Analytics (GA) alone, this visual, dynamic, and interactive online dashboard displays the behavior of your users and site visitors, presenting a wealth of metrics based on KPIs that explore session duration, page bounce rates, landing page conversion rates, and goal conversion rates, making a comprehensive marketing report that a user can additionally interact with and adjust.
This centralized mix of information provides a real insight into how people interact with your website, content, and offerings, helping you to identify weaknesses, capitalize on strengths, and make data-driven decisions that can benefit the business exponentially.
11. Implement text analysis
A vast quantity of data that businesses collect is unstructured. While having access to a breadth of data-driven insight is essential to enhancing your business intelligence (BI) capabilities, without implementing techniques of data analysis to give your metrics structure, you will only ever be scraping the surface.
Text analysis, also known in the industry as text mining, is the process of taking large sets of textual data and arranging it in a way that makes it easier to manage. By working through this cleansing process in stringent detail, you will be able to extract the data that is truly relevant to your business and use it to develop actionable insights that will propel you forward.
Modern analysis tools and techniques accelerate the process of text analytics, helping to collect and curate insights in a way that is efficient and results-driven.
Collectively, we create a colossal 2.5 quintillion bytes of digital data every single day, and a large segment is text-based. By investing in data analyst tools and techniques that will help you extract insight from various word-based data sources, including product reviews, articles, social media communications, and survey responses, you will gain invaluable insights into your audience, as well as their needs, preferences, and pain points.
By gaining this level of knowledge, you will be able to create campaigns, services, and communications that meet the needs of your prospects on a personal level, growing your audience while boosting customer retention. One of the most effective data analysis tools and techniques you will ever invest in.
12. Drill into diagnostic analysis
When it comes to lessons on how to do analysis, drilling down into diagnostic analysis is essential. Designed to provide direct and actionable answers to specific questions, this is one of the world’s most important methods in research, among its other key organizational functions such as retail analytics, e.g.
A powerful form of data discovery, diagnostic data analytics empowers analysts and business executives by helping them gain a firm contextual understanding of why something happened. If you know why something happened as well as how it happened, you will be able to pinpoint the exact ways of tackling the issue or challenge. To gain a practical understanding, it’s vital that you gain a foundational knowledge of the following two areas:
a) Predictive analytics
If you understand why a trend, pattern, or event happened through data, you will be able to develop an informed projection of how things may unfold in particular areas of the business. By doing so, you will be able to formulate initiatives or launch campaigns ahead of the curve, beating your competitors to the punch. Also, if you can use the predictive aspect of diagnostic analytics to your advantage, you will be able to prevent potential problems or inefficiencies from spiraling out of control, nipping potential problems in the bud. There are BI reporting tools that have predictive analytics options already implemented within them, but also made user-friendly so that you don't need to calculate anything manually or perform the robust and advanced analysis yourself.
b) Prescriptive analytics
Another of the most effective data analysis methods in research, prescriptive data techniques cross over from predictive analysis in the way that it revolves around using patterns or trends to develop responsive, practical business strategies.
By drilling down into prescriptive analysis, you will play an active role in the data consumption process by taking well-arranged sets of visual data and using it as a powerful fix to emerging issues in a number of key business areas, including marketing, sales, customer experience, HR, fulfillment, finance, logistics analytics, and others.
13. Consider autonomous technology
Autonomous technologies, such as artificial intelligence (AI) and machine learning (ML), play a significant role in the advancement of understanding how to analyze data more effectively.
Gartner predicts that by 2021, 80% of emerging technologies will be developed with AI foundations. This is a testament to the ever-growing power and value of autonomous technologies. At present, neural networks and intelligence alarms are driving the autonomous revolution in the world of data-driven analytics.
One of the techniques of data analysis of the modern age, intelligent alarms provide automated signals based on particular commands or occurrences within a dataset. For example, if you’re monitoring supply chain KPIs, you could set an intelligent alarm to trigger when invalid or low-quality data appears. By doing so, you will be able to drill down deep into the issue and fix it swiftly and effectively.
A neural network is a branch of machine learning - a form of data-driven analytics that attempts, with minimal intervention, to understand how the human brain would process insights and predict values. Neural networks learn from each and every data transaction, meaning that they evolve and advance over time.
14. Build a narrative
Now that we’ve discussed and explored the technical applications of data-driven analysis, we’re going to look at how you can bring all of these elements together in a way that will benefit your business - starting with a little something called data storytelling.
The human brain responds incredibly well to strong stories or narratives. Once you’ve cleansed, shaped, and visualized your most invaluable data using various BI dashboard tools, you should strive to tell a story - one with a clear-cut beginning, middle, and end.
By doing so, you will make your analytical efforts more accessible, digestible, and universal, empowering more people within your organization to use your discoveries to their actionable advantage.
15. Share the load
Last but certainly not least in our advice on how to make data analysis work for your business, we discuss sharing the load.
Expanding on our previous point, by using technical methods to give your data more shape and meaning, you will be able to provide a platform for wider access to data-driven insights.
If you work with the right tools and dashboards, you will be able to present your metrics in a digestible, value-driven format, allowing almost everyone in the organization to connect with and use relevant data to their advantage.
Modern data dashboards consolidate data from various sources, providing access to a wealth of insights in one centralized location, no matter if you need to monitor recruitment metrics or generate reports that need to be sent across numerous departments. Moreover, these cutting-edge tools offer access to dashboards from a multitude of devices, meaning that everyone within the business can connect with practical insights remotely - and share the load.
Once everyone is able to work with a data-driven mindset, you will catalyze the success of your business in ways you never thought possible. And when it comes to knowing how to make data analysis, this kind of collaborative approach is essential.


Nhận xét
Đăng nhận xét